  left middle  right
6373 3810 6817 STAT 479 Lecture 10
NFL WAR
Recap: EPA in Football
- 86-yard touchdown by Ladd McConckey on a pass from Justin Herbert (video link)
- Thrown on a 3rd and 26 from Chargers’ 14 yard line. EP = -1.54
- Chargers generated 7 - (-1.54) = 8.54 points of EP
- 64-yard touch down by Kavontae Turpin on a pass from Cooper Rush (video link)
- Thrown on 3rd and 10 from Cowboys’ 36 yard line. EP = 0.77
- Cowboys generated 7 - 0.77 = 6.23 points of EP
- How should we divide credit between QB and receiver?
- What about running?
Plan
- Estimate EPA per-play for each passer, receiver, & rusher
- Separately model three phases:
- Passing I: EPA due to actions while ball is in the air
- Passing II: EPA due to yards after catch
- Rushing
- Multi-level modeling:
- Random intercepts for passers, receivers, rushers
- Must adjust for important fixed effects
- W/ per-play EPA can compare actual production to replacement “shadow”
- These contrasts will lead to a version of WAR
Data Preparation
Overview
- Focus on 2024-25 regular season
- Need roster data to define position-specific replacement level
Passing Data
- Extract all passing plays (
play_type == "pass") - For each pass, record
posteam,defteam,posteamtypepasser_player_id,receiver_player_idshotgun,no_huddle,qb_hit,pass_locationair_yards,yards_after_catch,completed_pass
Air vs YAC EPA
- Teams generate EPA on completed passes while
- The ball is in the air
- On the ground, after the catch
- nflfastR decomposes
epaintoair_epaandyac_epa - Completed passes: imagine pausing game as soon as catch completed
- EP at the intermediate state used to compute
air_epaandyac_epa
- EP at the intermediate state used to compute
- Sacks: no good definition for
air_epa&yac_epa- We will treat sacks as rushing plays
Rushing Data
- Include columns for
passer_player_id&rusher_player_idshotgun&no_huddlerun_location&run_gap
- Must manually specify
rusher_player_idon sacks
Run Context I
run_locationindicates direction
  left middle  right
5425 3565 5172 run_gap:"guard": runs through B gap (b/w guard & tackles)"tackle": run through C gap (outside tackle or b/w tackle & end)"end": run through D gap (outside TE)NA: run through A gap (b/w center & guard)
        run_location
run_gap  left middle right <NA>
  end    1958      0  1805    0
  guard  1822      0  1739    0
  tackle 1645      0  1628    0
  <NA>      0   3565     0 1447
Run Context II
- We will create a new variable
run_context - Concatenate
run_location&run_gapwhen both notNA - For “A” gap runs,
run_context = "middle" - For sacks & fumbles, set
run_context = "other" - Additionally add
posteam: proxy for offensive linemen & blockers
Team Strengths
- Important to account for teammates & opponent quality (recall Lecture 4)
- Don’t overly reward players on good teams
- Don’t overly penalize players on bad teams
- Measure passing & rushing strength with mean EPA
- Add columns to
pass2024andrush2024
pass_strength <-
  pass2024 |>
  dplyr::group_by(posteam) |>
  dplyr::summarise(pass_strength = mean(epa,na.rm = TRUE))
rush_strength <-
  rush2024 |>
  dplyr::group_by(posteam) |>
  dplyr::summarise(rush_strength = mean(epa, na.rm = TRUE))

pass2024 <-
  pass2024 |>
  dplyr::inner_join(pass_strength, by = "posteam") |>
  dplyr::inner_join(rush_strength, by = "posteam")

rush2024 <-
  rush2024 |>
  dplyr::inner_join(pass_strength, by = "posteam") |>
  dplyr::inner_join(rush_strength, by = "posteam")
Modeling Passing EPA
Composite Outcomes
- \(\Delta\): observed EPA on a passing play
- \(\delta_{\textrm{air}}\) and \(\delta_{\textrm{yac}}\):
air_epaandyac_epagiven by nflfastR - Decompose \(\Delta = \Delta_{\textrm{air}} + \Delta_{\textrm{yac}}\) where \[ \Delta_{\textrm{air}} = \begin{cases} \delta_{\textrm{air}} & \textrm{if the pass is caught} \\ \Delta & \textrm{if the pass is incomplete,} \end{cases} \] and \[ \Delta_{\textrm{yac}} = \begin{cases} \delta_{\textrm{yac}} & \textrm{if the pass is caught} \\ 0 & \textrm{if the pass is incomplete.} \end{cases} \]
Modeling \(\Delta_{\textrm{air}}\)
\[ \begin{align} \Delta_{i, \textrm{air}} &= Q_{q[i]} + C_{c[i]} + D_{d[i]} + \boldsymbol{\mathbf{x}}_{i}^{\top}\boldsymbol{\beta} + \epsilon_{i}\\ Q_{q} &\sim N(\mu_{Q}, \sigma^{2}_{Q})\\ C_{c} &\sim N(\mu_{C}, \sigma^{2}_{C})\\ D_{d} &\sim N(\mu_{D}, \sigma^{2}_{D}). \end{align} \]
- Fixed effects include:
air_yards,shotgun,qb_hit,no_huddlepostteam_type(i.e. Home/Away),pass_locationreceiver_position&rush_strength
- Random intercepts for Quarterback, reCeiver, and Defense
Air Model Results
library(lme4)

air_model <-
  lmer(Delta_air ~ 1 + (1|passer_player_id) + (1 | receiver_player_id) + (1 | defteam )
       + air_yards + shotgun + qb_hit + no_huddle + posteam_type + pass_location + receiver_position + rush_strength,
       data = pass2024)
summary(air_model)
Linear mixed model fit by REML ['lmerMod']
Formula: Delta_air ~ 1 + (1 | passer_player_id) + (1 | receiver_player_id) +
(1 | defteam) + air_yards + shotgun + qb_hit + no_huddle +
posteam_type + pass_location + receiver_position + rush_strength
Data: pass2024
REML criterion at convergence: 56640.3
Scaled residuals:
Min 1Q Median 3Q Max
-9.6663 -0.4475 -0.0140 0.4521 4.2381
Random effects:
Groups Name Variance Std.Dev.
receiver_player_id (Intercept) 0.011544 0.10745
passer_player_id (Intercept) 0.002242 0.04735
defteam (Intercept) 0.001354 0.03680
Residual 1.622752 1.27387
Number of obs: 17000, groups:
receiver_player_id, 492; passer_player_id, 99; defteam, 32
Fixed effects:
Estimate Std. Error t value
(Intercept) -2.642055 0.573232 -4.609
air_yards 0.035027 0.001077 32.537
shotgun -0.081497 0.028132 -2.897
qb_hit -0.276667 0.036182 -7.647
no_huddle 0.134666 0.029805 4.518
posteam_typehome -0.008663 0.019728 -0.439
pass_locationmiddle 0.172170 0.026424 6.516
pass_locationright -0.034797 0.022336 -1.558
receiver_positionDL 4.627420 1.401649 3.301
receiver_positionLB 3.750986 1.070748 3.503
receiver_positionOL 2.527147 0.729736 3.463
receiver_positionQB 3.661843 0.934966 3.917
receiver_positionRB 1.922465 0.573394 3.353
receiver_positionTE 2.279044 0.573261 3.976
receiver_positionWR 2.254500 0.573040 3.934
rush_strength 0.307995 0.118268 2.604Model Interpretation
- \(Q_{q}\) : Per-pass EP added through air by passer \(q\) after adjusting for fixed effects
- \(C_{c}\): per-pass EP added when ball in air by receiver \(c\) after adjusting for fixed effects
- \(D_{d}\): per-pass EP added by offensive team when ball in air while facing defense \(d\)
- Negative \(D_{d}\) are good for the defense!
- Model: \(Q_{q}, C_{c}\) and \(D_{d}\) noisy deviations from league-wide averages \(\mu_{Q}, \mu_{C},\) and \(\mu_{D}.\)
- Cannot estimate the individual \(Q_{q}\)’s, \(C_{c}\)’s, or \(D_{d}\)’s
- Cannot estimate the global averages \(\mu_{Q}, \mu_{C},\) or \(\mu_{D}\)
- These parameters are not identifiable with the data alone
- Luckily: we can estimate deviations (e.g., \(Q_{q} - \mu_{Q}\))
Individual Points Added over Average
- For passer \(q\), let \(\textrm{IPA}^{(Q)}_{\textrm{air}, q} = Q_{q} - \mu_{Q}\)
- How much more EP does \(q\) add per play than league-average
- Similarly \(\textrm{IPA}^{(C)}_{\textrm{air}, c}\) and \(\textrm{IPA}^{(D)}_{\textrm{air}, d}.\)
tmp_air <- ranef(air_model)

air_passer_effects <-
  data.frame(
    gsis_id = rownames(tmp_air[["passer_player_id"]]),
    ipa_air_pass = tmp_air[["passer_player_id"]][,1])
air_receiver_effects <-
  data.frame(
    gsis_id = rownames(tmp_air[["receiver_player_id"]]),
    ipa_air_rec = tmp_air[["receiver_player_id"]][,1])
air_defense_effects <-
  data.frame(
    Team = rownames(tmp_air[["defteam"]]),
    tpa_air_def = tmp_air[["defteam"]][,1])
air_passer_effects |>
dplyr::inner_join(y = roster2024 |> dplyr::select(gsis_id, full_name), by = "gsis_id") |>
dplyr::select(full_name, ipa_air_pass) |>
dplyr::arrange(dplyr::desc(ipa_air_pass)) |>
dplyr::slice(c(1:5, (dplyr::n()-4):dplyr::n())) full_name ipa_air_pass
1 Joe Burrow 0.06736333
2 Sam Darnold 0.04033663
3 Lamar Jackson 0.03292716
4 Tua Tagovailoa 0.03281935
5 Brock Purdy 0.03000549
6 Drew Lock -0.02737783
7 Bo Nix -0.02808707
8 Dorian Thompson-Robinson -0.03832239
9 Spencer Rattler -0.05005097
10 Anthony Richardson -0.07074920Modeling \(\Delta_{\textrm{yac}}\)
- Fit a nearly-identical multilevel model using only completed passes
Dealing with Singularities
- Estimated no passer-to-passer variation
- Intuitive: once catch is made, who threw it doesn’t make a difference in terms of EPA.
Linear mixed model fit by REML ['lmerMod']
Formula: Delta_yac ~ 1 + (1 | passer_player_id) + (1 | receiver_player_id) +
    (1 | defteam) + air_yards + shotgun + qb_hit + no_huddle +
    posteam_type + pass_location + receiver_position + rush_strength
   Data: completions

REML criterion at convergence: 32367.4

Scaled residuals:
    Min      1Q  Median      3Q     Max
-8.9533 -0.5437 -0.2533  0.2882  7.4637

Random effects:
 Groups             Name        Variance  Std.Dev.
 receiver_player_id (Intercept) 0.0190108 0.1379
 passer_player_id   (Intercept) 0.0000000 0.0000
 defteam            (Intercept) 0.0006814 0.0261
 Residual                       0.9296857 0.9642
Number of obs: 11627, groups:
receiver_player_id, 468; passer_player_id, 90; defteam, 32

Fixed effects:
                     Estimate Std. Error t value
(Intercept)          1.710173   0.689922   2.479
air_yards           -0.022666   0.001214 -18.675
shotgun             -0.046899   0.025546  -1.836
qb_hit               0.037119   0.039172   0.948
no_huddle           -0.174386   0.027107  -6.433
posteam_typehome    -0.007157   0.018083  -0.396
pass_locationmiddle -0.057884   0.024339  -2.378
pass_locationright   0.011441   0.020532   0.557
receiver_positionDL -1.567487   1.193518  -1.313
receiver_positionLB -0.728621   0.974493  -0.748
receiver_positionOL -1.046652   0.781368  -1.340
receiver_positionQB -0.728794   0.974704  -0.748
receiver_positionRB -0.515251   0.689574  -0.747
receiver_positionTE -0.837277   0.689576  -1.214
receiver_positionWR -0.847828   0.689446  -1.230
rush_strength        0.382583   0.105680   3.620
optimizer (nloptwrap) convergence code: 0 (OK)
boundary (singular) fit: see help('isSingular')Computing IPA for YAC
- Using
ranef, we can extract YAC-specific IPAs for passers, receivers, and defenses - Top-10 based on \(\textrm{IPA}^{(C)}_{\textrm{yac}, c}\) contains many well-known receivers
         full_name ipa_yac_rec
1  Marvin Mims Jr.   0.4038113
2    Khalil Shakir   0.2763021
3  KaVontae Turpin   0.2225070
4    Xavier Worthy   0.2179003
5     Tucker Kraft   0.2141390
6     Brock Bowers   0.1885809
7    Austin Ekeler   0.1830305
8   Antonio Gibson   0.1818104
9    Ja'Marr Chase   0.1778265
10  Raheem Mostert   0.1729994
Rushing Model
Handling QB Runs
- Play-by-play data doesn’t distinguish between
- Designed QB runs
- Scrambles on broken plays
- We will fit two separate models for EPA on rushing plays
Multilevel Models
- QB Run Model:
- Fixed effects:
shotgun,no_huddle,posteam_type,pass_strength - Random intercepts:
rusher_player_id&defteam
- Fixed effects:
- Non-QB Model
- Fixed effects: same as QB-model +
rusher_position&run_context - Random intercepts: same as QB-model
- Fixed effects: same as QB-model +
- Use
ranef()to extract \(\textrm{IPA}^{(R)}_{r}\) for Runner r
qbrun_fit <-
  lmer(epa ~ 1 + (1 | rusher_player_id) + (1 | defteam) +
         shotgun + no_huddle + posteam_type + pass_strength,
       data = qb_runs)
nonqb_run_fit <-
  lmer(epa ~ 1 + (1 | rusher_player_id) + (1 | defteam) +
         shotgun + no_huddle + posteam_type + rusher_position + run_context + pass_strength,
       data = nonqb_runs)
full_name ipa_run
1 De'Von Achane 0.13626662
2 Saquon Barkley 0.10131412
3 Jahmyr Gibbs 0.09383069
4 Jerome Ford 0.08473154
5 Chuba Hubbard 0.08423388
6 J.K. Dobbins 0.07766485
7 Emari Demercado 0.07656891
8 Dameon Pierce 0.06755530
9 Rico Dowdle 0.06517368
10 Taysom Hill 0.06219509Creating NFL WAR
Total Individual Points Added Above Average
- For every offensive player, estimate how more EP they add per-play than league-average
- Through the air (\(\textrm{IPA}^{(Q)}_{\textrm{air}, q}\), \(\textrm{IPA}^{(C)}_{\textrm{air}, c}\))
- After the catch (\(\textrm{IPA}^{(Q)}_{\textrm{yac}, q}\), \(\textrm{IPA}^{(C)}_{\textrm{yac}, c}\))
- Rushing (\(\textrm{IPA}^{(R)}_{r}\))
- Multiplying \(\textrm{IPA}\) by number of attempts yields \(\textrm{IPAA}\): total points added above average
Computing IPAA
passer_ipaa <-
  pass2024 |>
  dplyr::group_by(passer_player_id) |>
  dplyr::summarise(n_pass = dplyr::n()) |>
  dplyr::rename(gsis_id = passer_player_id) |>
  dplyr::left_join(air_passer_effects, by = "gsis_id") |>
  dplyr::left_join(yac_passer_effects, by = "gsis_id") |>
  dplyr::mutate(
    ipaa_air_pass = ipa_air_pass * n_pass,
    ipaa_yac_pass = ipa_yac_pass * n_pass) |>
  dplyr::left_join(y = roster2024 |> dplyr::select(gsis_id, full_name, position), by = "gsis_id")
passer_ipaa |>
dplyr::select(full_name, n_pass, ipa_air_pass, ipa_yac_pass, ipaa_air_pass, ipaa_yac_pass) |>
dplyr::arrange(dplyr::desc(ipaa_air_pass)) |>
dplyr::slice_head(n = 10)# A tibble: 10 × 6
full_name n_pass ipa_air_pass ipa_yac_pass ipaa_air_pass ipaa_yac_pass
<chr> <int> <dbl> <dbl> <dbl> <dbl>
1 Joe Burrow 628 0.0674 0 42.3 0
2 Sam Darnold 512 0.0403 0 20.7 0
3 Lamar Jackson 454 0.0329 0 14.9 0
4 Brock Purdy 440 0.0300 0 13.2 0
5 Tua Tagovailoa 388 0.0328 0 12.7 0
6 Justin Herbert 484 0.0262 0 12.7 0
7 Baker Mayfield 562 0.0198 0 11.1 0
8 C.J. Stroud 509 0.0166 0 8.45 0
9 Russell Wilson 306 0.0231 0 7.07 0
10 Geno Smith 554 0.0110 0 6.07 0# A tibble: 10 × 6
full_name n_rec ipa_air_rec ipa_yac_rec ipaa_air_rec ipaa_yac_rec
<chr> <int> <dbl> <dbl> <dbl> <dbl>
1 Tee Higgins 109 0.182 -0.0741 19.9 -8.07
2 Amon-Ra St. Brown 141 0.139 0.0563 19.6 7.93
3 Ladd McConkey 112 0.148 -0.0124 16.5 -1.38
4 Terry McLaurin 117 0.118 -0.0612 13.7 -7.16
5 DeVonta Smith 89 0.142 -0.0383 12.7 -3.41
6 Jauan Jennings 113 0.111 -0.118 12.6 -13.3
7 Jakobi Meyers 129 0.0928 0.00289 12.0 0.373
8 Justin Jefferson 153 0.0746 0.0566 11.4 8.66
9 Courtland Sutton 135 0.0812 -0.156 11.0 -21.1
10 Jonnu Smith 111 0.0910 0.166 10.1 18.4 # A tibble: 10 × 4
full_name ipa_qbrun n_qbrun ipaa_qbrun
<chr> <dbl> <int> <dbl>
1 Jayden Daniels 0.469 184 86.3
2 Josh Allen 0.703 108 75.9
3 Anthony Richardson 0.667 94 62.7
4 Jalen Hurts 0.307 167 51.3
5 Bo Nix 0.481 102 49.1
6 Lamar Jackson 0.322 150 48.2
7 Kyler Murray 0.336 102 34.3
8 Brock Purdy 0.319 92 29.4
9 Patrick Mahomes 0.344 74 25.5
10 Daniel Jones 0.283 88 24.9# A tibble: 10 × 4
full_name ipa_run n_run ipaa_run
<chr> <dbl> <int> <dbl>
1 Saquon Barkley 0.101 346 35.1
2 De'Von Achane 0.136 203 27.7
3 Jahmyr Gibbs 0.0938 250 23.5
4 Chuba Hubbard 0.0842 250 21.1
5 Derrick Henry 0.0520 325 16.9
6 Rico Dowdle 0.0652 235 15.3
7 J.K. Dobbins 0.0777 195 15.1
8 Bijan Robinson 0.0477 304 14.5
9 Najee Harris 0.0481 263 12.7
10 Chase Brown 0.0505 229 11.6Replacement Level
- Multilevel models involved global-averages \(\mu_{Q}, \mu_{C}, \mu_{R}\)
- Represent the average latent intercept across theoretical super-population
- Assumption: observed players are randomly sampled from this super-population
- Not strictly correct to say IPA measures contribution above “league-average”
- Will define roster-based thresholds for “replacement level”
- Construct a replacement-level “shadow”
- Compute average \(\textrm{IPA}\) for replacement-level players
- Shadow IPAA: multiply avg. replacement-level IPA by attempts
- Compare observed IPAA to shadow IPAA
Defining Replacement Level
Most rosters: 3 running backs, 4 wide receivers, 2 tight ends
Create separate thresholds for position & type of play
For passing plays:
- Top \(32 \times 4\) WRs sorted by
n_rec - Top \(32 \times 2\) TEs sorted by
n_rec - Top \(32 \times 3\) RB
- Top \(32 \times 4\) WRs sorted by
For running plays
- Top \(32 \times 3\) RBs sorted by
n_runs - Top \(32 \times 1\) WR & TEs sorted by
n_runs
- Top \(32 \times 3\) RBs sorted by
Running IPAR
run_ipaa <-
  run_ipaa |>
  dplyr::mutate(
    repl_wrte = dplyr::case_when(
      position %in% c("WR", "TE") & n_run < wrte_run_threshold ~ 1,
      position %in% c("WR", "TE") & n_run >= wrte_run_threshold ~ 0,
      !position %in% c("WR", "TE") ~ NA),
    repl_rb = dplyr::case_when(
      position == "RB" & n_run < rb_run_threshold ~ 1,
      position == "RB" & n_run >= rb_run_threshold ~ 0,
position != "RB" ~ NA))- Compute average IPA for all replacement-level players
# A tibble: 10 × 3
   full_name      ipaa_run ipar_run
   <chr>             <dbl>    <dbl>
 1 Saquon Barkley     35.1     38.5
 2 De'Von Achane      27.7     29.7
 3 Jahmyr Gibbs       23.5     25.9
 4 Chuba Hubbard      21.1     23.5
 5 Derrick Henry      16.9     20.1
 6 Rico Dowdle        15.3     17.6
 7 Bijan Robinson     14.5     17.5
 8 J.K. Dobbins       15.1     17.1
 9 Najee Harris       12.7     15.2
10 Chase Brown        11.6     13.8
Computing Remaining IPAR’s
- Virtually same process for both passing IPAR’s
- Top 10 YAC IPAR
# A tibble: 10 × 3
   full_name        ipaa_yac_rec ipar_yac_rec
   <chr>                   <dbl>        <dbl>
 1 Ja'Marr Chase            31.1         31.3
 2 Brock Bowers             28.9         30.2
 3 Khalil Shakir            27.6         27.7
 4 DJ Moore                 22.5         22.6
 5 Brian Thomas Jr.         22.4         22.5
 6 Xavier Worthy            21.4         21.4
 7 Marvin Mims Jr.          21.0         21.0
 8 Jonnu Smith              18.4         19.4
 9 Puka Nacua               16.4         16.4
10 Tucker Kraft             14.8         15.4
Replacement-level QB
- Every offensive play runs through the QB
- Idea 1: designate one QB per team as non-replacement
- E.g., QB w/ most rushing & passing attempts
- Problem: assumes every NFL team has at least one non-replacement QB
- Idea 2: sort QBs by total number of passes & rushes & take top-32
- Top-10 IPAR via passing
# A tibble: 10 × 3
full_name ipa_air_pass ipar_air_pass
<chr> <dbl> <dbl>
1 Joe Burrow 0.0674 44.6
2 Sam Darnold 0.0403 22.6
3 Lamar Jackson 0.0329 16.6
4 Brock Purdy 0.0300 14.8
5 Justin Herbert 0.0262 14.5
6 Tua Tagovailoa 0.0328 14.2
7 Baker Mayfield 0.0198 13.2
8 C.J. Stroud 0.0166 10.4
9 Russell Wilson 0.0231 8.21
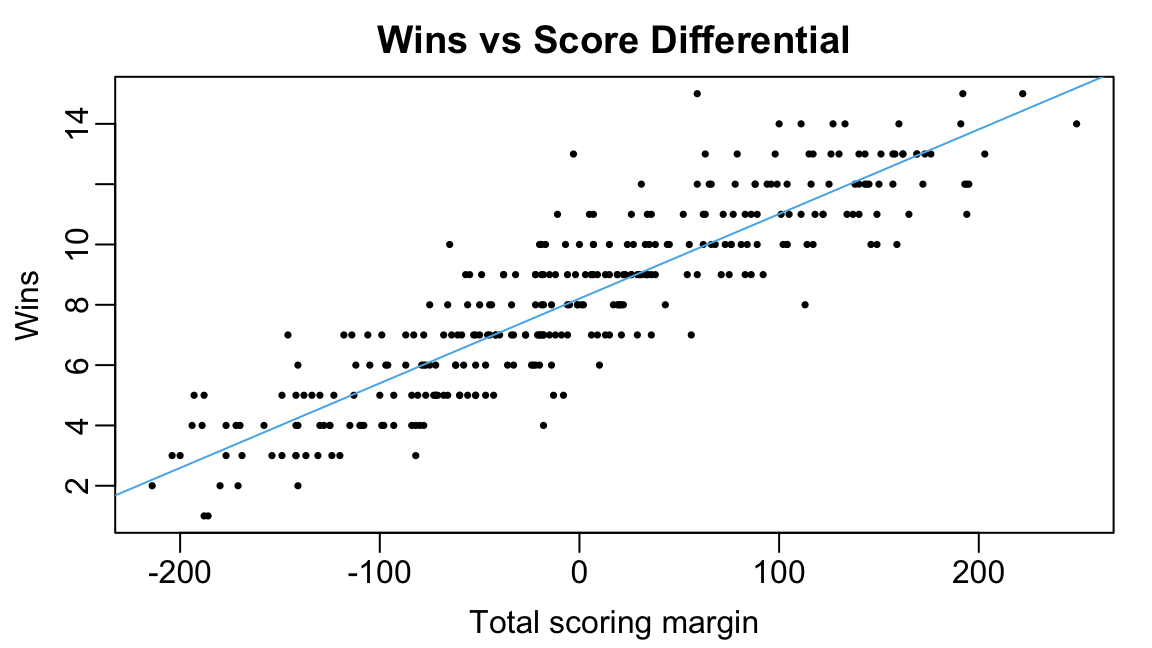
10 Geno Smith 0.0110 8.13Converting Points to Wins
- IPAR are on point-differential scale
- Find \(\alpha\) & \(\beta\) s.t. \(\textrm{Wins} \approx \alpha + \beta \times \textrm{PtsDiff}\)
- Then multiply IPAR values by \(\beta\)
Skill-Position WAR
- Convert each IPAR to wins scale & then sum
- Top-10 Skill Positions
           full_name       war
1      De'Von Achane 1.2408245
2     Saquon Barkley 1.1551989
3      Ja'Marr Chase 1.0545348
4       Jahmyr Gibbs 0.8666242
5        Jonnu Smith 0.8446721
6  Amon-Ra St. Brown 0.8086111
7       Brock Bowers 0.7438843
8      Derrick Henry 0.6381019
9         Puka Nacua 0.6084343
10  Justin Jefferson 0.6012925
Reminders
Project reports & presentations due at 12pm (noon) on Friday
Please also upload recording to shared Box folder (link on Canvas)
I’ll announce peer review assignments by Thursday night
- You must review 3 reports & presentations of 3 other teams
- Due on 10/17
- Rubric + constructive comments